- Solution Architecture
- solution-design
- aws
- cloud-native-geospatial
- postgis
Designing a Peatland Fire Detection System for Central Kalimantan on AWS and Open-Source GIS
An end-to-end design for detecting peatland fires in Central Kalimantan with free satellite data, open-source GIS and AWS, and why each component was chosen.
What problem does this system solve?
It turns free satellite fire data into field tasks fast enough to matter, and keeps a history of what burned. This is a design exercise for a fictional provincial agency in Central Kalimantan, built only on public data, open-source GIS and AWS. No real client, no real budget.
The starting point I assumed is common in disaster operations: staff look at hotspot maps by hand, decide where to send fire brigades by experience, and map the burned area after the season, if at all. Three things are missing:
- Speed and consistency. Whether a hotspot gets attention depends on who is on shift.
- Prioritisation. Brigades are few, hotspots are many, and nothing ranks them.
- Memory. Detections, field checks and burned areas are not stored in one place, so next season starts from zero.
The system has three kinds of users: an operations room that triages alerts, field teams that check and report, and leaders who need a weekly picture by district.
Why Central Kalimantan?
Because its fires are mostly peat fires, which are hard to put out once they spread. In the 1990s the Mega Rice Project dug more than 4,500 km of canals to drain peat for a planned million hectares of rice fields. The drained peat stayed dry and flammable. In 2019, fires burned across nearly 270,000 hectares of land in the province, much of it on former project areas.
Peat fires smoulder below the surface and can burn for weeks. That shapes the whole design: the value of the system is in the first hours, before a surface fire becomes a peat fire.
What does the system have to do?
Five functions, and a short list of qualities that apply to all of them.
| Need | What the system does |
|---|---|
| Early warning | Pulls new hotspots several times a day and turns them into ranked fire clusters |
| Prioritisation | Scores each cluster with transparent rules and caps the daily list at what brigades can check |
| Field validation | Sends tasks to a mobile app that works offline, with photos, GPS and a short form |
| Burned area | Maps burned area from optical imagery after fire events and stores it as polygons |
| Reporting | A dashboard by district, peat status and period, plus the status of the last pipeline run |
| Quality | Design rule |
|---|---|
| Auditability | Status changes are appended, never overwritten; every polygon records its source scene and parameters |
| Reliability | A failed run is retried and visible on the dashboard; a missed run must never look like "no fires" |
| Security | Role-based access; field data and internal notes are not public |
| Interoperability | Other agencies read the data through open standards (OGC services), not exports by email |
| Cost | Pay for compute when pipelines run; no software licences |
Stated assumptions: field capacity is the scarcest resource, connectivity in the field is unreliable, and the agency prefers data stored in Indonesia.
Why two pipelines with two rhythms?
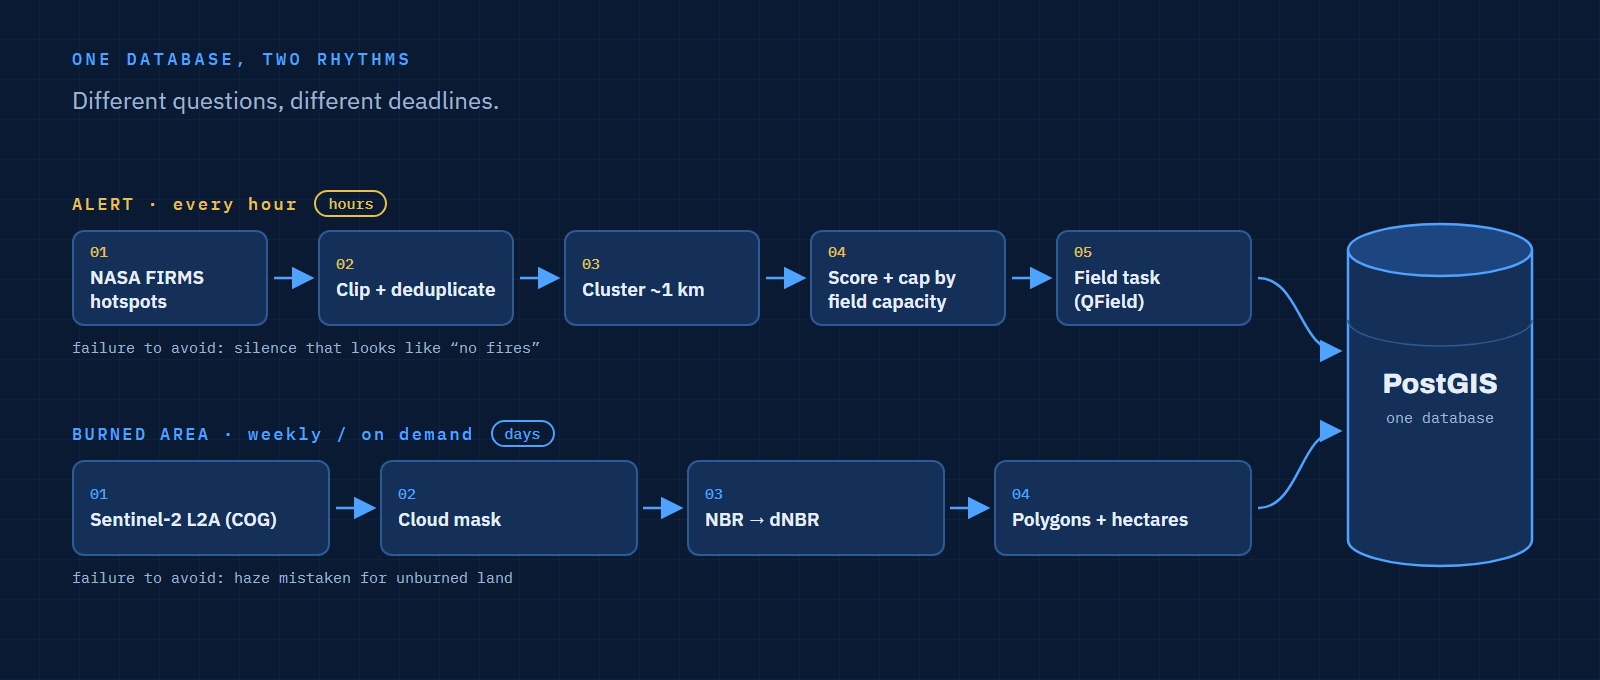
Because fire has two questions with very different deadlines. "Where is it burning now?" needs an answer in hours. "What burned, and how much?" can wait for a clear satellite image days later. Forcing both into one schedule makes one of them wrong: either the alert is too slow or the mapping job runs on cloudy images for nothing.
| Alert pipeline | Burned area pipeline | |
|---|---|---|
| Question | Where is it burning now? | What burned, and how much? |
| Data | NASA FIRMS hotspots (VIIRS and MODIS) | Copernicus Sentinel-2 L2A |
| Trigger | Schedule, every hour | Schedule, weekly, and on demand after an event |
| Output | Ranked fire clusters and field tasks | Burned area polygons with area in hectares |
| Compute | Seconds, small tables | Minutes, large rasters |
| Failure mode to avoid | Silence that looks like "no fires" | Cloud and haze mistaken for unburned land |
 Open full size
FIRMS publishes global active fire data within three hours of the satellite pass. Polling every hour means a new detection waits at most an hour on our side, which keeps the agency's own delay smaller than the satellite's.
What does the architecture look like end to end?
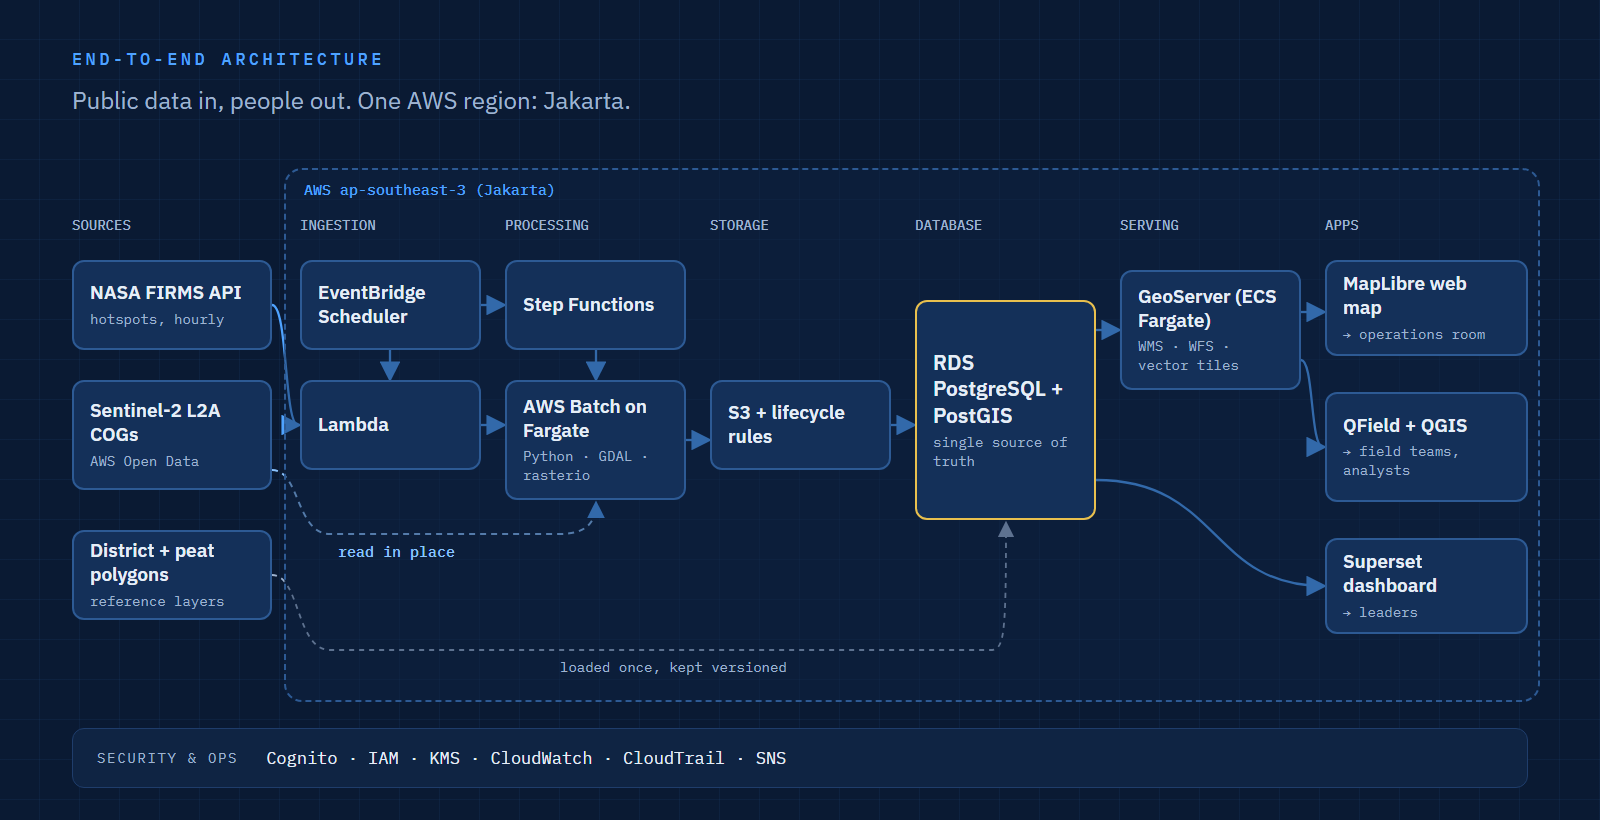
Seven layers, from public data sources to the people who act on them. Everything runs in one AWS region, Asia Pacific (Jakarta), except the open imagery archive, which the pipeline reads in place.
 Open full size
| Layer | Component | Role |
|---|---|---|
| Sources | NASA FIRMS API, Sentinel-2 L2A COGs on the AWS Registry of Open Data, district and peat boundary polygons | Free inputs |
| Ingestion | Amazon EventBridge Scheduler, AWS Lambda | Fetch new hotspots every hour |
| Processing | AWS Step Functions, AWS Batch on Fargate (Python, GDAL, rasterio) | Cluster and score hotspots; compute burned area |
| Storage | Amazon S3 with lifecycle rules | Clipped imagery, outputs, run logs |
| Database | Amazon RDS for PostgreSQL with PostGIS | Clusters, polygons, tasks, status history |
| Serving | GeoServer on Amazon ECS (Fargate) | WMS, WFS and vector tiles for every client |
| Apps | MapLibre web map, Apache Superset dashboard, QField and QGIS | Operations room, leaders, field teams, analysts |
| Cross-cutting | Amazon Cognito, IAM, KMS, CloudWatch, CloudTrail, Amazon SNS | Access, encryption, monitoring, audit, notifications |
Why this tech stack?
Each choice answers one requirement, and each has an alternative I would switch to under a different constraint.
| Component | Why this one | When I would choose something else |
|---|---|---|
| NASA FIRMS | Free, global, available within three hours, with a simple API; VIIRS detects at 375 m | For alerts within minutes, add geostationary data (see the last section) |
| Sentinel-2 L2A | Free and open, 10–20 m resolution, already atmospherically corrected, and stored on AWS as Cloud-Optimized GeoTIFFs with a STAC search API | Sentinel-1 radar when haze and cloud block optical images for weeks |
| EventBridge Scheduler + Lambda | An hourly call that returns a small CSV does not justify an always-on server; it costs almost nothing when idle | A container if the job grows past Lambda's 15-minute limit |
| Step Functions + AWS Batch | Raster jobs need GDAL, memory and minutes of runtime, which suits containers. Step Functions adds retries and a visible run history, which feeds the "last run" panel on the dashboard | Airflow or Kestra if the agency already runs one for other pipelines; for two pipelines, a scheduler server is overhead |
| S3 + COG reads | The pipeline reads only the pixels inside the province from the open archive instead of copying whole scenes; lifecycle rules delete imagery after its retention period | None at this scale |
| PostgreSQL + PostGIS | The core questions are spatial joins and clustering (which district, on peat or not, which hotspots belong together), and PostGIS does them in SQL. Analysts open the same tables directly in QGIS | A data warehouse such as Athena or Redshift only if years of history make analytical queries slow |
| GeoServer | One server publishes the same layers as OGC services to QGIS, QField, the web map and other agencies | Lighter tile servers (Martin, pg_tileserv) if web maps were the only client |
| MapLibre GL JS | Open-source web map rendering vector tiles, hosted as static files on S3 and CloudFront | None needed |
| Apache Superset | Filters, charts and maps on PostGIS without writing a front end, with role-based access | A custom page if leaders need only three numbers |
| QField + QGIS | QField runs QGIS projects on phones, works offline and syncs back; forms and styles are built once in QGIS | ODK or KoboToolbox if the form matters more than the map |
| Jakarta region | Keeps agency data in Indonesia | The open imagery archive is hosted outside Indonesia; only the clipped result is stored locally |
How does a hotspot become a field task?
In six steps, and the ranking is a set of visible rules rather than a black-box model.
- Fetch. Lambda calls the FIRMS area API for the province's bounding box and loads new detections into a staging table.
- Clip and deduplicate. Keep points inside the province polygon; drop detections already loaded from an earlier call.
- Cluster. Group detections within about 1 km of each other in the last 24 hours into one fire cluster.
- Enrich. Attach district, peat status and land cover to each cluster with spatial joins.
- Score and cap. Rank clusters and keep only as many "priority" tasks as field teams can check that day.
- Assign and track. Create a task for QField, notify the duty officer through SNS, and append every status change.
-- Step 3: cluster today's hotspots (UTM 50S, metres; ~1 km, at least 2 points)
SELECT id,
ST_ClusterDBSCAN(ST_Transform(geom, 32750), eps => 1000, minpoints => 2)
OVER () AS cluster_id
FROM hotspots
WHERE acq_time > now() - interval '24 hours';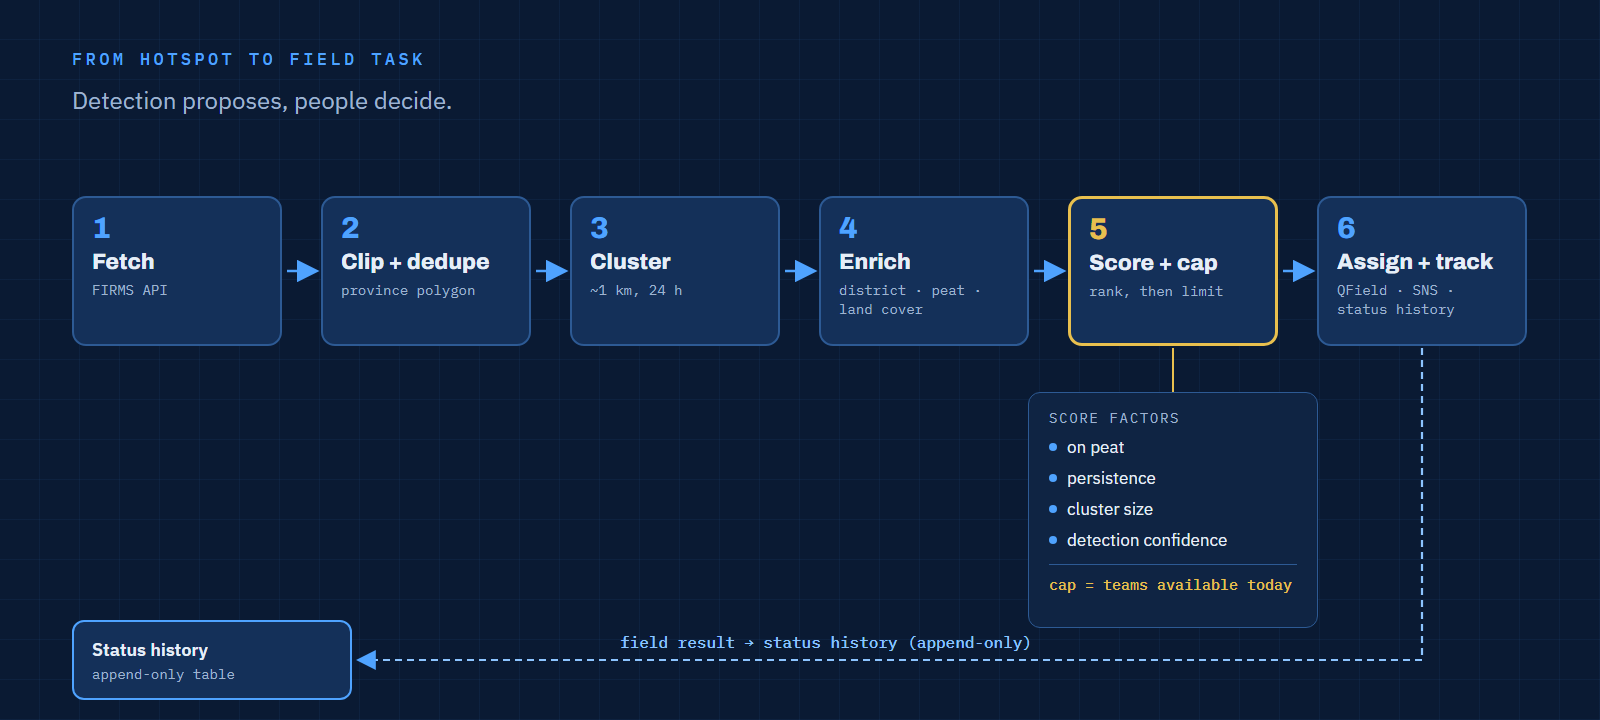 Open full size
| Scoring factor | Why it matters |
|---|---|
| On peat | Peat fires spread underground and are hardest to stop |
| Persistence | Detected again in a later pass means it is still burning |
| Cluster size | More detections usually means a larger fire |
| Detection confidence | FIRMS flags low-confidence detections |
The cap is the important part. If every cluster above a threshold is "priority", a bad day produces a list nobody can finish, and the label stops meaning anything. Ranking against the real number of available teams keeps the top of the list actionable. Each task shows its score and the factors behind it, so a duty officer can disagree with a reason.
How is the burned area mapped?
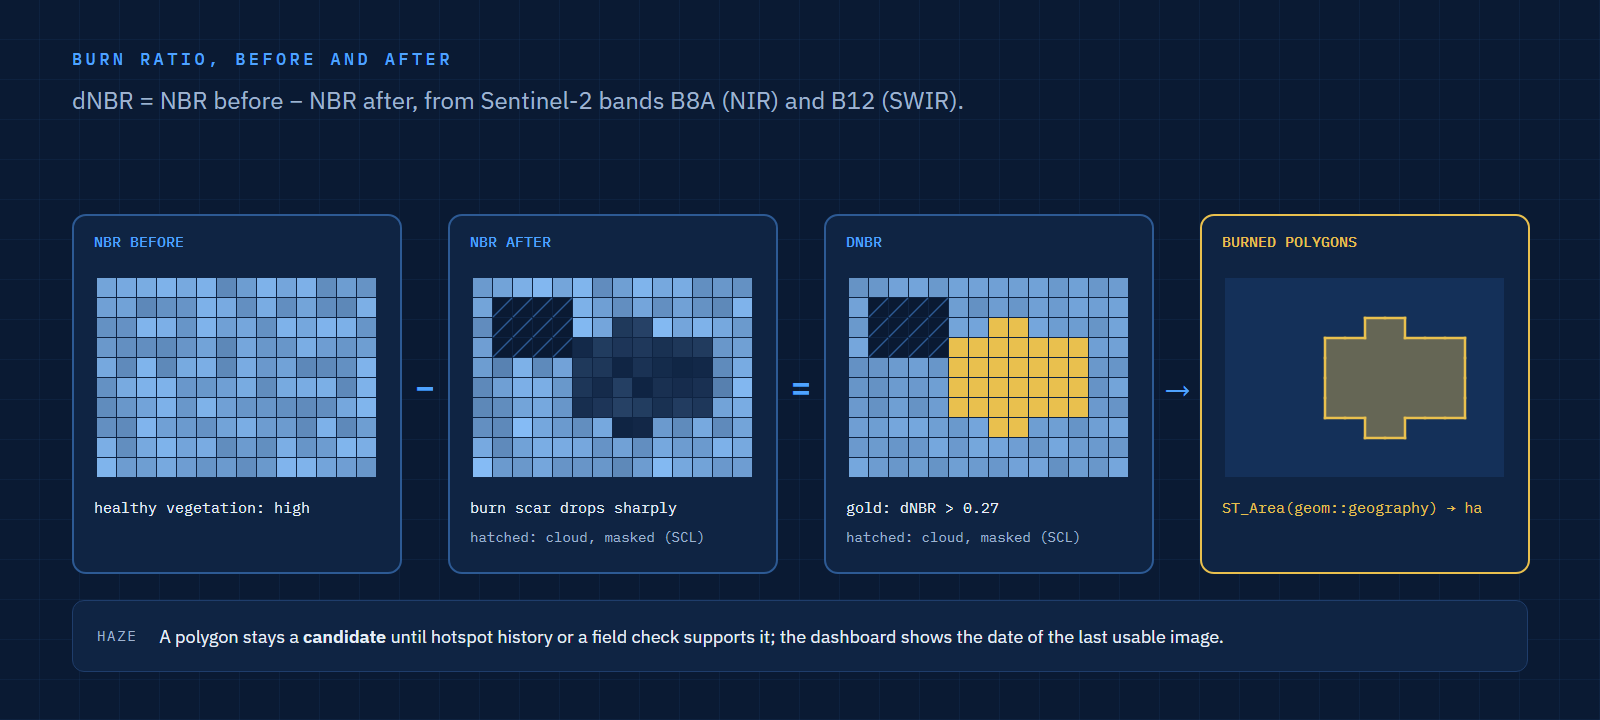
With the difference in burn ratio before and after the fire, computed from two Sentinel-2 bands. The Normalized Burn Ratio uses near-infrared (B8A) and shortwave infrared (B12); burned vegetation lowers it, so a large drop between a pre-fire and a post-fire image marks burned land.
# Burned area candidate from two cloud-masked Sentinel-2 L2A images
nbr_pre  = (pre.B8A - pre.B12) / (pre.B8A + pre.B12)
nbr_post = (post.B8A - post.B12) / (post.B8A + post.B12)
dnbr = nbr_pre - nbr_post
burned = dnbr > 0.27          # starting threshold, tuned against field checks
The batch job then masks cloud and shadow with the L2A scene classification layer, turns burned pixels into polygons, drops slivers below a minimum area, and computes area in hectares in PostGIS with ST_Area(geom::geography), which avoids picking one UTM zone for a province that spans two.
 Open full size
Haze is the honest limitation. During the worst weeks, optical images may be useless. The design treats a burned area polygon as a candidate until it is supported by hotspot history or a field check, and the dashboard shows when the last usable image was taken.
How is the system secured, monitored and kept?
With managed AWS services and a few rules that matter more than the tools.
| Concern | Design |
|---|---|
| Access | Amazon Cognito for web and dashboard users; roles for operations, field, leadership and analysts |
| Encryption | KMS-encrypted S3 and RDS; TLS everywhere |
| Audit | CloudTrail for infrastructure; an append-only status history table for every task and polygon |
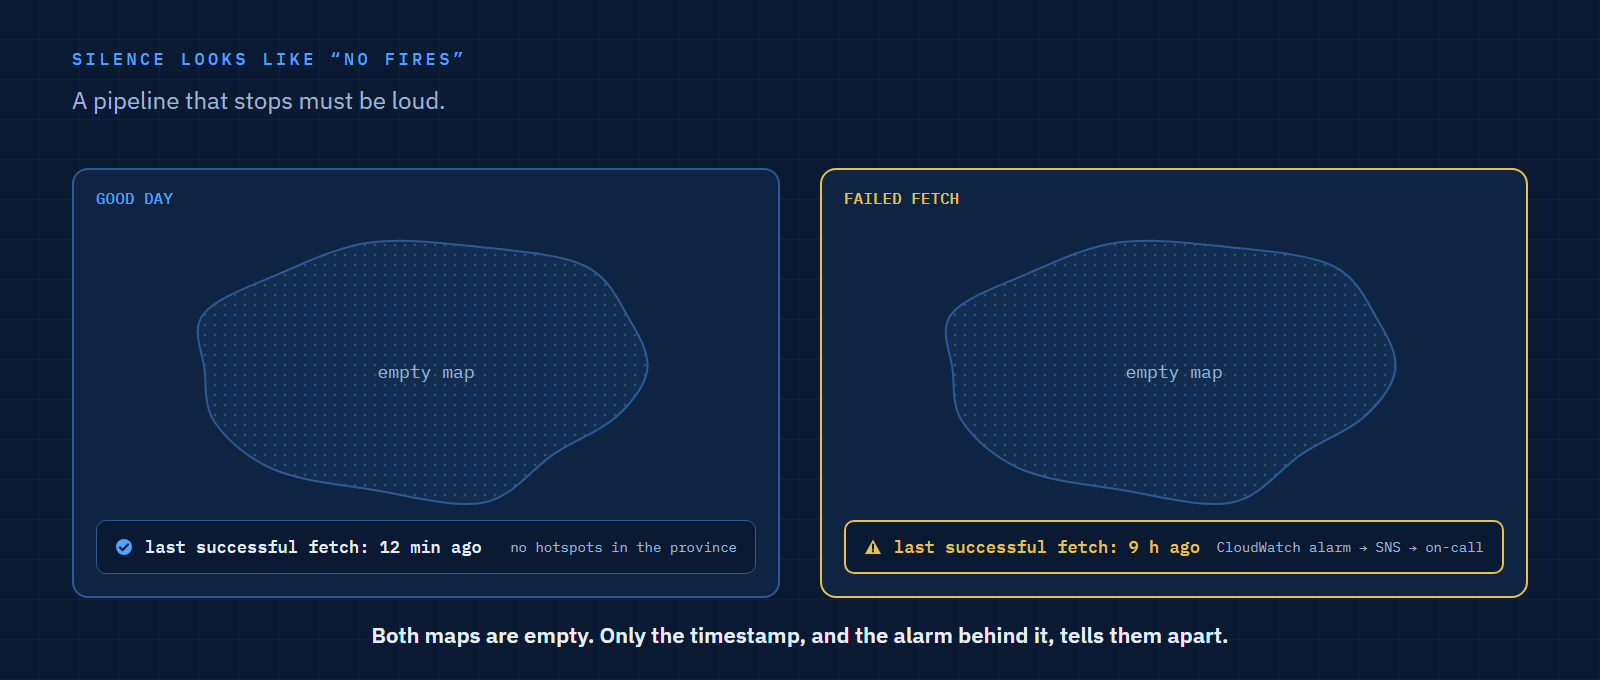
| Monitoring | CloudWatch alarms on failed runs; the dashboard shows the time of the last successful fetch |
| Backup and recovery | RDS automated backups and snapshots; infrastructure defined as code so the stack can be rebuilt |
| Retention | S3 lifecycle rules delete clipped imagery after its retention period; vector history is kept |
The monitoring rule I care most about: a pipeline that stops must be loud. An empty map after a failed fetch looks exactly like a good day.
 Open full size
What did I deliberately leave out?
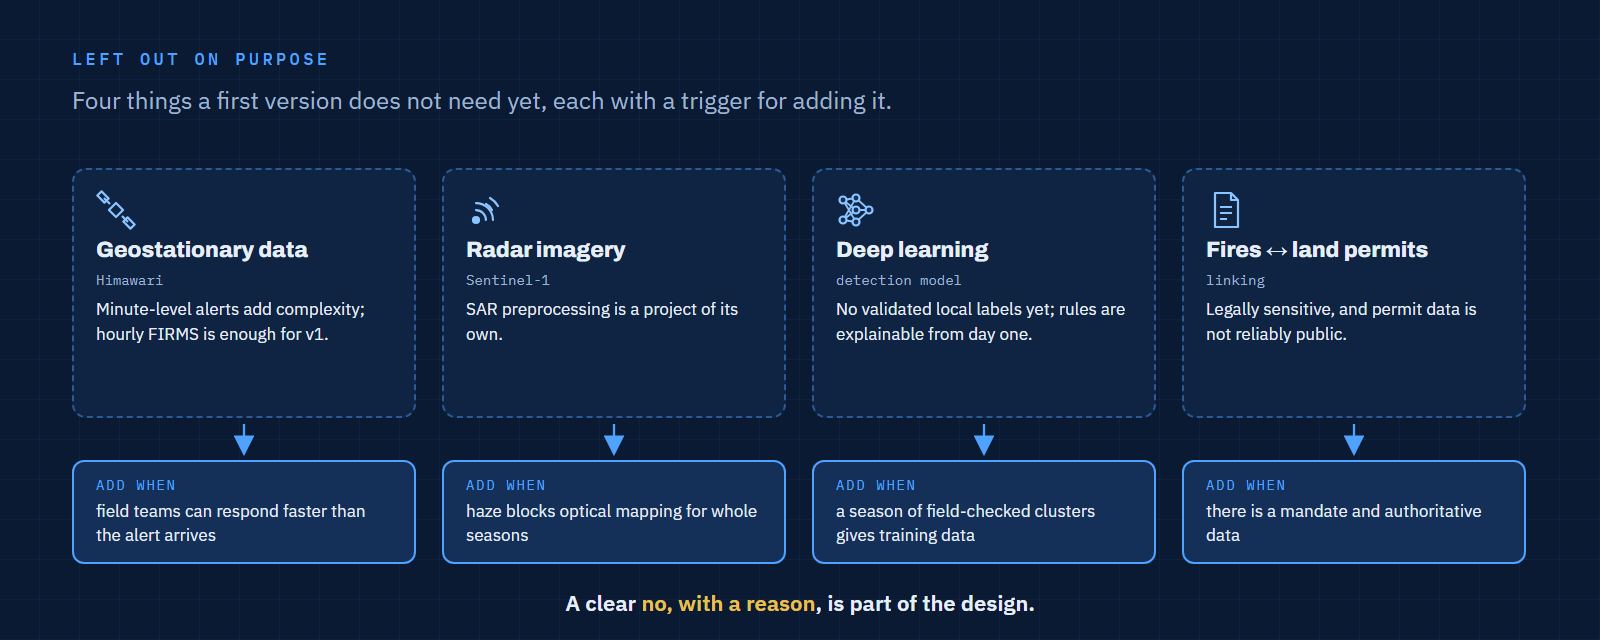
Four things that would make a first version harder to deliver without making it more useful yet.
| Left out | Why | When to add it |
|---|---|---|
| Geostationary data (Himawari) | Alerts within minutes add complexity; hourly FIRMS is enough for a first version | When field teams can respond faster than the alert arrives |
| Sentinel-1 radar | SAR preprocessing is a project of its own | When haze blocks optical mapping for whole seasons |
| Deep learning | No validated local labels yet; rules are explainable from day one | After a season of field-checked clusters provides training data |
| Linking fires to land permits | Legally sensitive, and permit data is not reliably public | Only with a mandate and authoritative data |
 Open full size
I wrote more about this habit, documenting the no, in Documenting What I Didn't Build.
FAQ
Can Copernicus Sentinel data be used in a government system?
Yes. Access to Sentinel data is free, full and open, including for operational and commercial use. Products derived from it should credit the source, for example "Contains modified Copernicus Sentinel data".
Why not rely on hotspots alone?
Hotspots say where it was hot at the moment of a satellite pass. They do not give the extent of what burned, and they miss fires under thick smoke or between passes. Burned area mapping fills that gap afterwards.
Why PostGIS and not a data warehouse?
The workload is operational: frequent small writes, spatial joins and clustering, and analysts editing in QGIS. That is what PostgreSQL with PostGIS is built for. A warehouse becomes useful later for multi-year analysis.
Is this design tied to Central Kalimantan?
No. Swapping the province polygon, peat map and UTM zone adapts it to Riau, South Sumatra or any fire-prone region.
References
- Fire Information for Resource Management System (FIRMS), NASA Earthdata
- Sentinel-2 Cloud-Optimized GeoTIFFs, Registry of Open Data on AWS
- Step by step: Burn Severity with Python and optical data (Sentinel-2), UN-SPIDER
- Indonesia's Mega Rice Project and the peatland food crisis, Mongabay, 2020
- ST_ClusterDBSCAN, PostGIS documentation
- QFieldCloud, OPENGIS.ch
- Why People Should Learn Architecture Framework Thinking in the AI Era, on this site
Last updated: 3 November 2026.