- Skill Set
- problem-solving
- project-management
- solution-design
When a Metric Looks Too Good: Fixing AHT at the Source
A project's handling time looked impressively low. It was wrong. How a random quality sweep found the gap, and why we fixed the master template, not the report.
Why should a metric that looks too good worry you?
Because nobody investigates good news. A bad number triggers a complaint and a root-cause analysis. A great number gets praised, copied into slides and left alone. That is exactly how an error can survive for months.
Ours surfaced through a random quality sweep, not a complaint. One project's average handling time was remarkably low. The team looked fast. The number was wrong.
What is AHT, and why did this one matter?
Average handling time (AHT) is the total time spent handling work divided by the number of tasks handled. In Map Operations it measured how long each map task took: collecting, editing or reviewing a place or a road.
This was not a vanity number. AHT was one of the core metrics the division tracked across countries. It went into regular review meetings between leaders, and it was used to justify each project's effort and staffing. If one project's AHT is understated, that project looks cheaper than it is, and every comparison against it is unfair to the others.
What did we suspect first?
The obvious explanation was the flattering one: the team was simply fast. Some teams are.
So we tested it against reality. Given what each task involves, could someone really finish it in that time? The answer was no. The gap was too large to be skill or practice. Something that should have been counted was not.
Where was the time going missing?
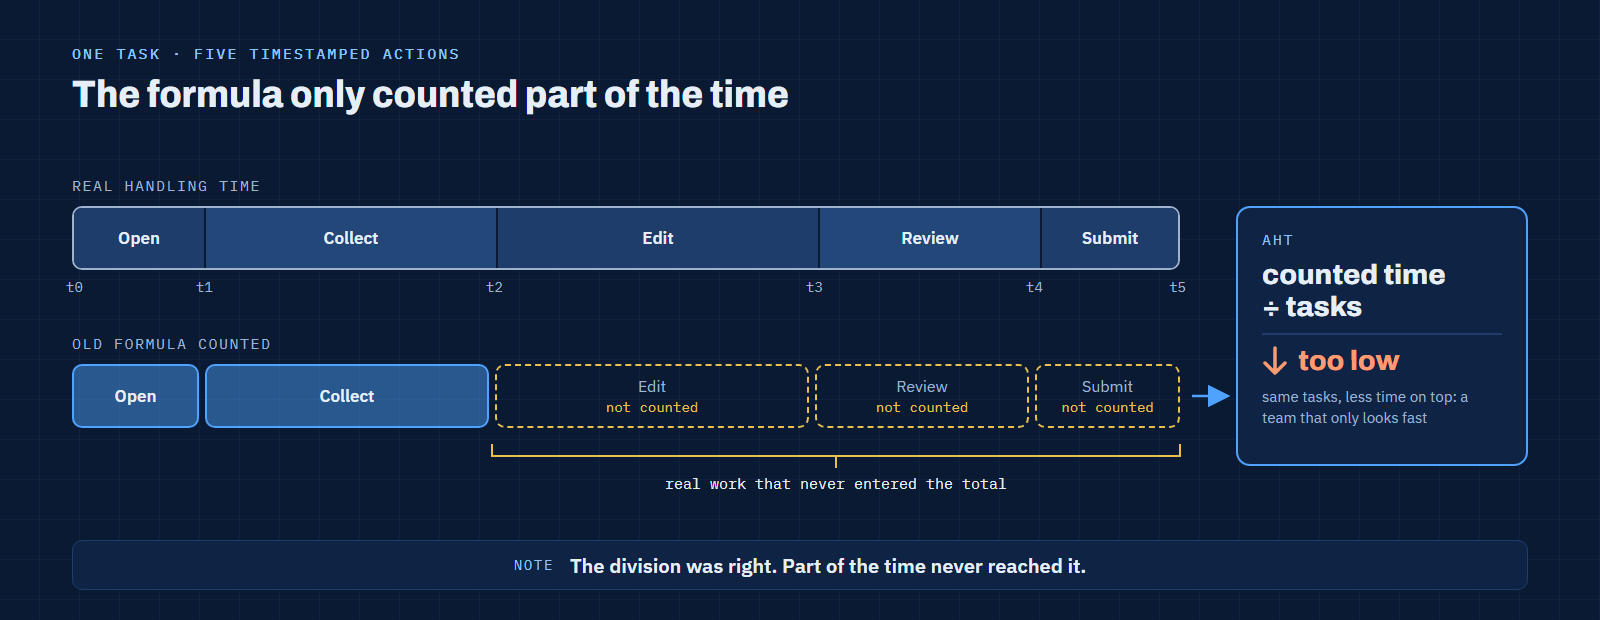
Each task in the worksheet was broken into several timestamped actions recorded by the operations team. The formula was supposed to add up the handling time from those actions and divide by the number of tasks.
The division itself was fine. The problem was what went into it: the formula didn't cover every action cell in a task's breakdown, so part of the real working time never entered the total. Less time on top of the same number of tasks produces an AHT that looks impressively low.
 Open full size
| Old formula | Fixed formula | |
|---|---|---|
| Actions counted per task | Some of the timestamped actions | Every action in the task's breakdown |
| Unit of counting | Inconsistent between sheets | Standardised per task |
| Resulting AHT | Too low, looked like a fast team | Realistic and comparable across projects |
Standardising the unit mattered as much as adding the missing cells. If one sheet counts per action and another per task, the same work produces two different AHTs, and leaders end up comparing definitions instead of performance.
Why fix the master worksheet instead of the report?
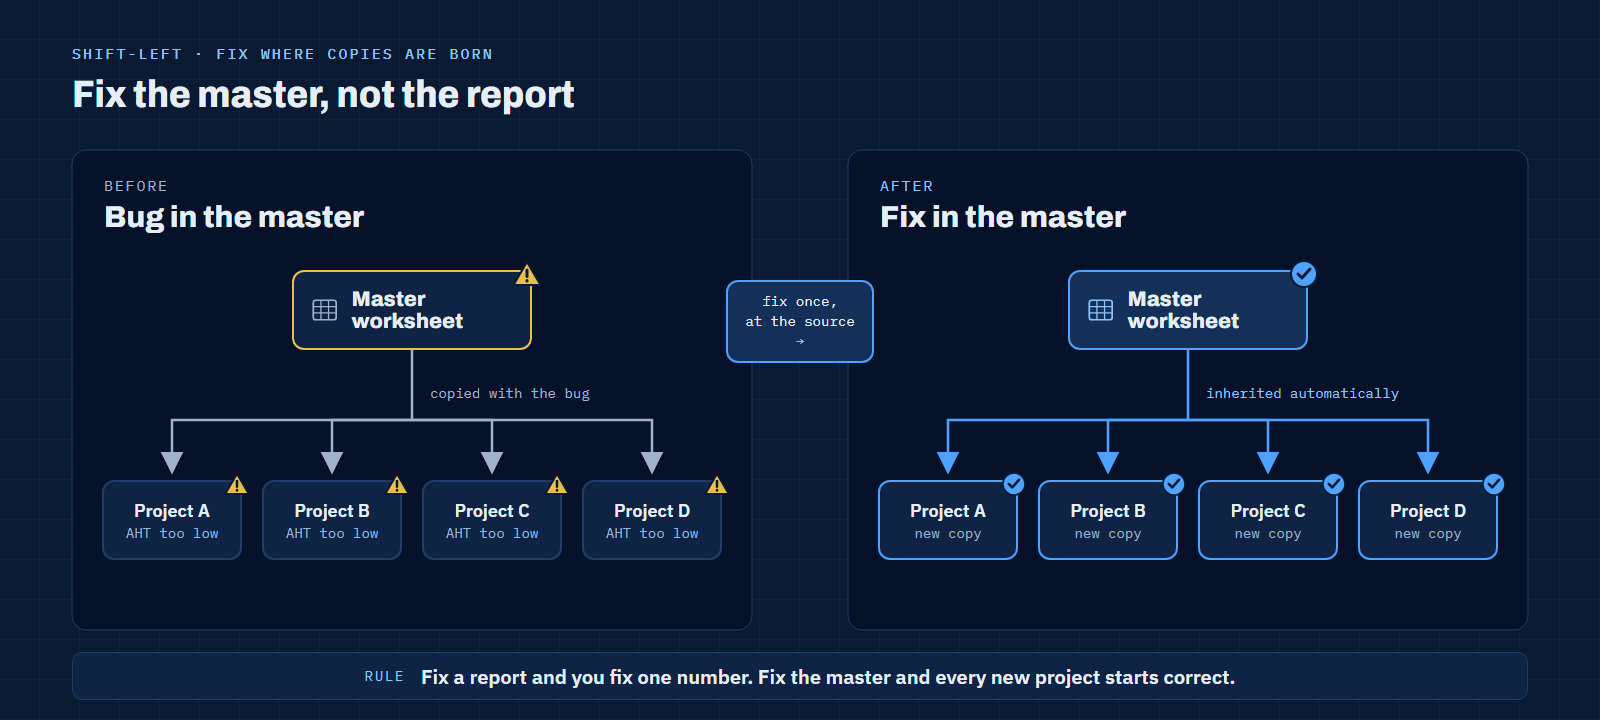
Every new project started from a copy of a master worksheet. That meant the flawed formula wasn't one mistake. It was a template that reproduced the mistake in every project that copied it.
 Open full size
So we corrected the formula in the master worksheet itself. From then on, any team starting a new project in a new worksheet got the corrected calculation automatically, without anyone remembering to patch it.
This is what shift-left means in data quality: move the check or the fix as close to where the data is created as possible. Cleaning numbers downstream, report by report, treats the symptom and guarantees you will clean them again next month.
Why does an accurate AHT matter beyond one project?
Because the metric travelled. AHT from each country rolled up into division-level reviews, and decisions about effort and priorities leaned on it. An understated AHT doesn't only flatter one team. It quietly makes every honest project look slow by comparison.
An accurate, consistently defined AHT gave each project a fair justification. Teams were compared on the work they did, not on which version of a spreadsheet they happened to copy.
What is the reusable pattern?
Any metric built from many copied templates, whether spreadsheets, dashboards or dbt models, carries the same risk.
- Investigate good outliers. A number that is too good deserves the same root-cause analysis as one that is too bad.
- Test against reality. Ask whether the number is physically plausible before you ask whether the team is talented.
- Sweep at random. Complaints only find problems that hurt someone. Random quality checks find the ones that flatter someone.
- Fix the template, not the copy. Correct the logic where every new instance is born, so the fix spreads by default.
- Version your definitions. When the formula changes, mark the break, so nobody reads a definition change as a performance change.
The same instinct runs through this series: in the polygon-gap article, a lookup table silently undercounted revenue; here, a template silently undercounted time. Both looked fine until someone checked the inputs.
FAQ
What is average handling time (AHT)?
The total time spent handling tasks divided by the number of tasks handled. It is a standard operations metric in support centres and back-office teams, and only as reliable as the time and task counts that feed it.
What is shift-left data quality?
Checking and fixing data as close as possible to where it is created, instead of correcting it later in reports. A fix at the source protects every downstream use at once.
Why use random quality sweeps if there are no complaints?
Because complaints are biased toward problems that hurt someone. Errors that make a number look better rarely generate complaints, so only a deliberate, random check will find them.
References
- When a Polygon Gap Becomes a Revenue Gap, the previous article in this series
- Geospatial Product Ops: Between Maps and Business, on running root-cause analysis on wins as well as losses
Last updated: 30 October 2026.