- Skill Set
- project-management
- geo-tech
Geospatial Product Ops: Between Maps and Business
Geospatial Product Ops turns operational problems into spatial solutions. What 8 years at Grab taught me about working between map data, product, and business.
What is Geospatial Product Ops?
Geospatial Product Ops is the work of turning operational problems into spatial solutions that people actually use. For eight years at Grab, I did this from the seat between map data, product and business: making sure the map behind every booking was good enough for drivers and passengers, and useful enough for the business that depended on it.
Officially, my team was called Map and Product Operations. We covered three areas: points of interest (POIs), routing and navigation, and the IoT devices that feed map-making. Our daily counterparts were product managers, engineers, transport and business operations, B2B partners and the product marketing team.
Why don't I use my official title?
"Map operations" sounds like someone editing points on a map. Some of the job was exactly that, especially in the early years. But most of what I did later touched anything with a location attached to it: large geospatial datasets in the data lake, the dashcams and 360° cameras mounted on partner vehicles to collect imagery, the geofences that decide which service runs where, and the features built on top of GrabMaps.
So I call it Geospatial Product Ops. Geospatial because the raw material was always location data. Product because the output was always a feature, or a decision that changed how the product behaved. Ops because none of it counted unless it ran every day, in every city, without someone babysitting it.
My background explains why the technical side came naturally. I studied Geographic Information Science at Universitas Gadjah Mada, with a minor in statistics and programming, so spatial data was a language I already spoke when I joined.
What happens when every team wants something different?
One launch shows the role better than any job description. We were bringing indoor navigation to an airport: a feature that guides a passenger from inside the terminal to the right pickup point.
Every team at the table had a reasonable goal, and they pulled in different directions:
- Product and my lead wanted the whole airport mapped by a fixed date.
- Airport business development was still negotiating with the airport operator. Customs and immigration were off limits; only public areas could be mapped.
- Engineering's tool for converting our QGIS work into the indoor format was still unstable, and there was no agreed procedure for loading field data into it.
- The campaign team needed a slot on the booking screen to drive adoption, but that slot already had a queue of higher-priority promos.
None of these was a map problem in the narrow sense. My job was to turn them into a plan that could ship. We scoped the mapping to public areas, so the business negotiation stopped blocking the data work. We agreed an input procedure with engineering, so collected data stopped breaking the conversion tool. And we negotiated a geofence-based placement, so the feature appeared only to people physically at the airport. That fit around the promo queue instead of fighting it.
That pattern repeated in almost every launch. The map was the easy part. Getting five teams to agree on what "done" meant was the work.
What does the role actually cover?
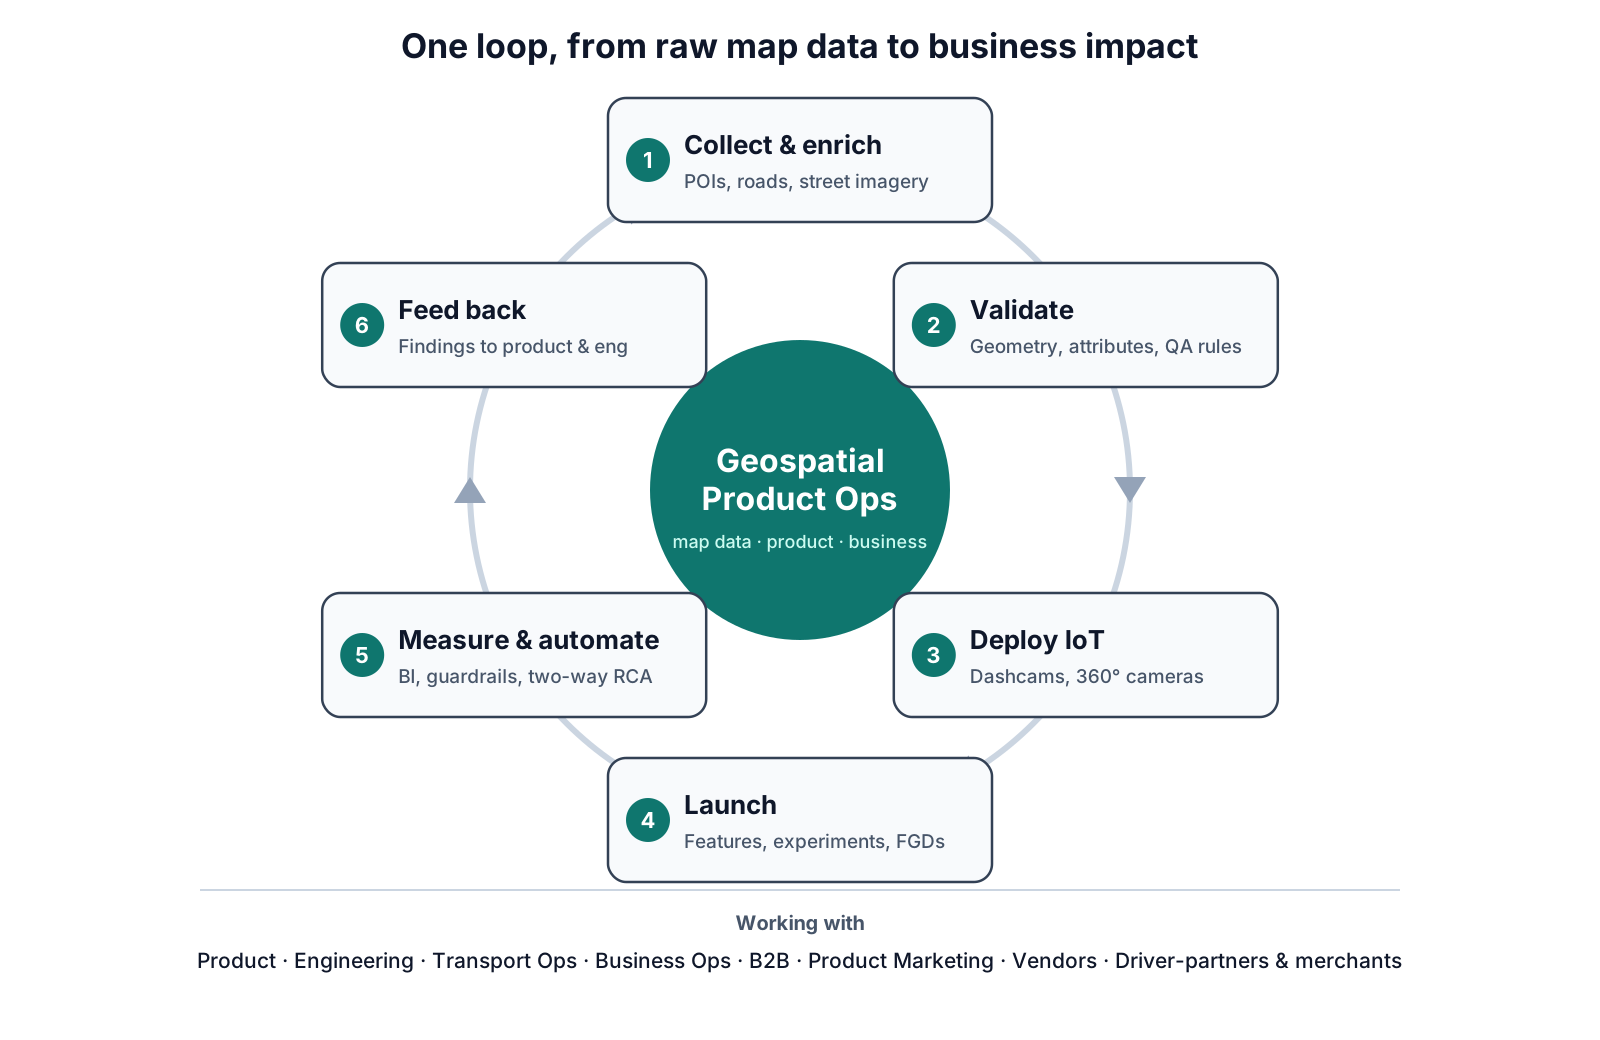
The clearest way to describe the scope is as a loop. Read the diagram clockwise from the top: data comes in, gets checked, goes live, gets measured, and what we learn goes back to the start.
 Open full size
- Collect and enrich. Planning collection and enrichment for POIs, roads and street imagery, and deciding where field teams and vendors should go first.
- Validate. Checking geometry and attributes, with validation rules that catch errors before they reach the app.
- Deploy IoT. Running dashcam and 360° camera operations on fleet and driver-partner vehicles: installation, training, and checking that what came back was usable.
- Launch. Shipping map features and supporting experiments. Product managers and data scientists designed the experiments; my team suggested treatment areas, watched guardrail metrics during the test, and dug into the reasons behind the numbers before a launch decision.
- Measure and automate. BI, analysis and automation, the part I consider my own expertise.
- Feed back. Turning findings into proposals for product and engineering, which starts the loop again.
Focus groups were often where the next loop began. Merchants told us that moving their pickup location meant a slow approval process, while their business was already open and losing orders. That made the case for letting owners correct their own location. Driver-partners told us two things: GPS lag on some phones made it look as if they hadn't moved when they had, and reporting a closed or damaged road meant leaving the map for a separate support form. Road reporting later moved into GrabMaps itself.
What made it a technical role?
A list of tools doesn't make a role technical. QGIS, Databricks, spreadsheets, Google Apps Script, Superset and internal tools were all part of the day. The real test is simpler: could the decision have been made without someone who could read the data directly? For most of my work, the answer was no.
Finding blind spots in dense areas. Some neighbourhoods had plenty of POIs on the map but still produced feedback that a place couldn't be found. Sending collectors everywhere would have wasted vendor budget. Instead, we joined POI density with "place not found" feedback at the smallest geohash level, and sent field teams only to the cells where the two disagreed, with a list of the POI types missing there.
-- Simplified illustration (not production code):
-- geohash cells that look well covered but still generate "place not found" feedback
with density as (
  select geohash7, count(*) as poi_count
  from pois
  group by geohash7
),
feedback as (
  select geohash7, count(*) as not_found_reports
  from user_feedback
  where feedback_type = 'place_not_found'
  group by geohash7
)
select d.geohash7, d.poi_count, f.not_found_reports
from density d
join feedback f using (geohash7)
where d.poi_count >= 50          -- looks well covered
  and f.not_found_reports >= 10  -- but people still can't find places
order by f.not_found_reports desc;
Choosing where IoT lockers go next. With 200+ food lockers running in Jakarta, the next question was where to expand. GMV alone pointed to the obvious cities. Combining it with booking volume and merchant availability, against thresholds agreed in advance, produced a shortlist of candidate sites that could actually sustain a locker.
Turning a campaign idea into deployable polygons. The campaign team wanted transport promos priced differently by POI type and time of day: a school at 7 a.m. is not a mall at 7 p.m. There were far too many locations to draw by hand, so I built a spatial model that classified and clustered the POIs into polygons ready to load into our internal configuration tool.
The automation I'm proudest of is less glamorous. Project hours, attendance, quality scores and missing hours lived across many spreadsheets. I built a Google Apps Script pipeline that turned them into one structured dashboard, with triggers that alerted the ops team or their lead when hours weren't logged properly, or when a project needed quality fixes that hadn't been done yet.
How did the role change over 8 years?
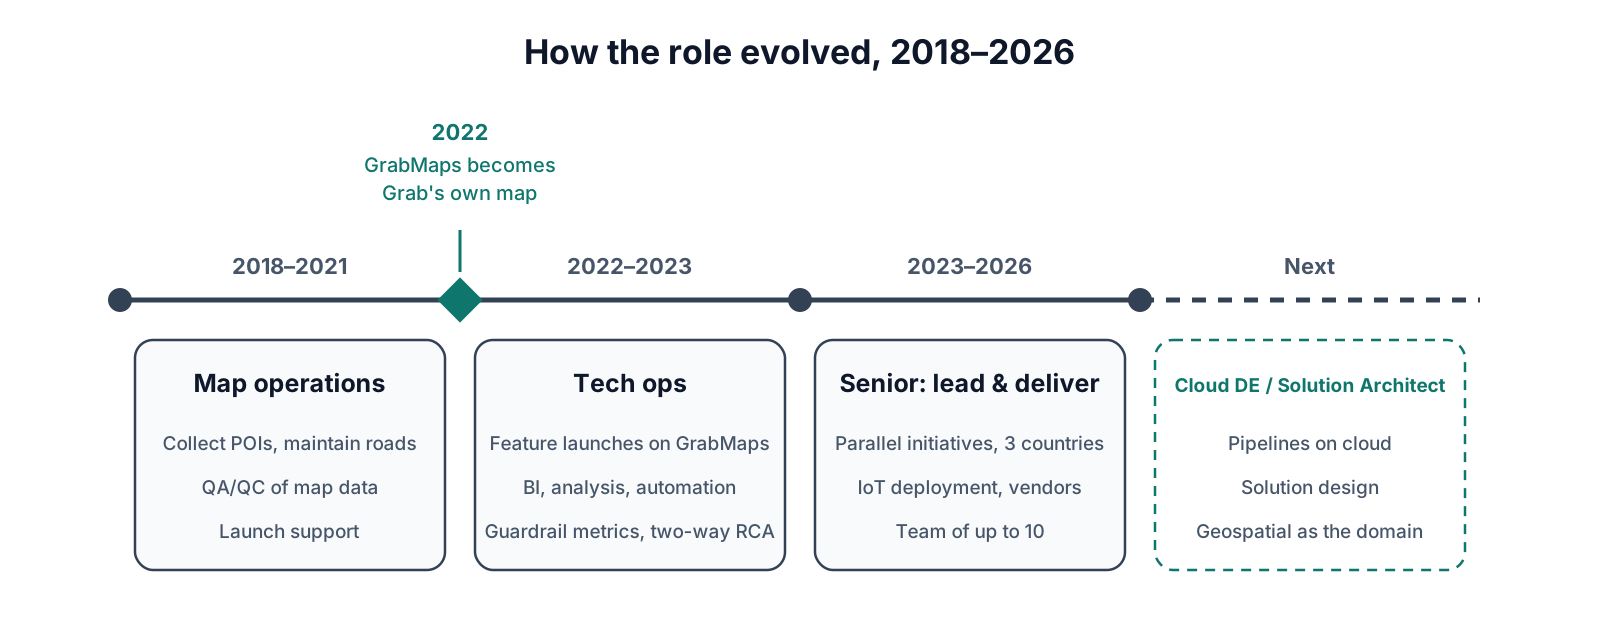
When I joined in 2018, the work was mostly operational: collecting POIs, maintaining roads, keeping data quality up. That changed when GrabMaps became Grab's own map. By 2023, Grab reported that GrabMaps powered its services in all eight countries where it operates. Once the map was ours, every improvement was ours to launch, and ours to answer for.
 Open full size
Two things changed most.
Launches. We could now build features a licensed map would never have let us configure. Malls, airports and stations got entrance-level pickup points, so drivers and passengers could find each other without a phone call. The hard part was that cars and motorbikes often need different pickup spots, and switching between them needed configuration that wouldn't confuse users. Route suggestions could differ by service, toll or non-toll, which changed the fare shown. Indoor navigation could sit inside the booking flow and guide a passenger from the third floor of a mall to the right exit.
Metrics. My team watched the guardrail metrics behind these features: cancellations tied to a POI, how often drivers followed the suggested route, and whether people stayed on GrabMaps navigation or switched to another app. Route adherence shows why context matters. It is never meant to reach 100%, because passengers ask for detours and road conditions change. A drop only means something once you've ruled those out.
We ran root-cause analysis in both directions. A drop meant something to fix. A spike, after a data enrichment push, a campaign, or sometimes by accident, meant something to understand and copy to other cities or services. Most teams only investigate their failures. Investigating the wins turned out to be just as useful.
| Before: map operations | After: tech ops | |
|---|---|---|
| Main output | Collected and corrected map data | Launched features and data-backed decisions |
| Data work | Spreadsheets and QGIS | SQL on the data lake, BI, automation |
| Success measured by | Volume and accuracy of edits | Guardrail metrics and adoption |
| Worked mostly with | Ops team and vendors | Product, engineering, business, B2B, marketing |
| When a number moved | Fix the record | Find the root cause, then fix it or replicate it |
From 2023 the scope widened again. As a senior, I led a team of up to ten and ran several initiatives in parallel across Indonesia, Thailand and Myanmar, including dashcam and food locker deployments, street imagery collection and indoor navigation. Toward the end, data enrichment increasingly ran through partners and AI-assisted tooling. I didn't build that technology; my part was the operational roadmap and making sure the data met the quality those systems needed.
What ties it all together?
The common thread is translation. An engineer sees a bug, the business sees lost revenue, a passenger sees the wrong pickup point. Often it's the same problem described three ways. The job was to recognise that, find where it actually started, and turn it into something one team could ship.
A few lessons I'd carry into any role:
- Read the data yourself. The fastest root-cause analysis was always the one I didn't have to wait for.
- Scope is a negotiation tool. Limiting the airport to public areas unblocked everything else.
- Investigate wins as seriously as losses. A spike you can explain is a strategy you can repeat.
- Write the input procedure before the first collection, not after the tool starts breaking.
Where am I taking this next?
Location technology isn't only for ride-hailing. Logistics, retail, agriculture, utilities and small local businesses all make decisions that depend on where things are, and most still make them without a proper spatial layer. That's why I'm moving toward cloud data engineering and solution architecture with a geospatial focus: building the pipelines and designing the systems that let any organisation, from large industries to small businesses, use location data the way Grab learned to.
I've started with an end-to-end pipeline on public NYC taxi data, from raw trips to a spatial analysis of where supply misses demand: NYC Taxi Supply-Demand Gap. The next article in this series goes deep into one Grab problem: how small gaps between service boundaries turned into areas with no service at all.
FAQ
Is Geospatial Product Ops the same as GIS?
No. GIS is one of the tools. Geospatial Product Ops uses spatial data to launch features, run operations and support business decisions, so it sits closer to product and operations than to cartography.
Do you need to code for this role?
Not always, but SQL and some Python change what you can decide on your own. Without them, every question waits in another team's queue.
What is a guardrail metric?
A metric that must not get worse while you improve the main one. If a feature reduces cancellations but makes pickups slower, the guardrail catches it.
References
- Grab to be fully powered by its own mapping technology by Q3 2022, Grab press release, June 2022
- Grab Makes World's Most Innovative Companies by Fast Company for 2023, Business Wire, March 2023
- NYC Taxi Supply-Demand Analysis, project repository